Peak Ridership (Pre-COVID)
461.8 M
Lowest Point (COVID Trough)
205.0 M
Peak-to-Trough Drop (%)
55.6%
2022 Recovery Status
237.1 M
Average ridership of mass transit modes
Bus Ridership & Infrastructure Investment correlation by Period
Correlation heatmap
Bus ridership is counter-cyclical – it increases when GDP declines and unemployment rises.
Influential Factors on Ridership (Pre-COVID)
The growth of real GDP exerts the strongest impact on bus ridership.
Peak Ridership (Pre-COVID)
415.6 M
Lowest Point (COVID Trough)
157.6 M
Peak-to-Trough Drop (%)
62.09%
2022 Recovery Status
226.7 M
Average ridership of mass transit modes

Rail Ridership & Infrastructure Investment correlation by Period
Correlation heatmap
Infrastructure investment (spending_transit) and economic growth (real_gdp) show the strongest positive correlations with Urban Rail ridership
Influential Factors on Ridership (Pre-COVID)
Economic growth (Real GDP) is by far the strongest positive driver of Urban Rail ridership.
Peak Ridership (Pre-COVID)
18.1 M
Lowest Point (COVID Trough)
9.2 M
Peak-to-Trough Drop (%)
49.05%
2022 Recovery Status
12.4 M
Average ridership of mass transit modes

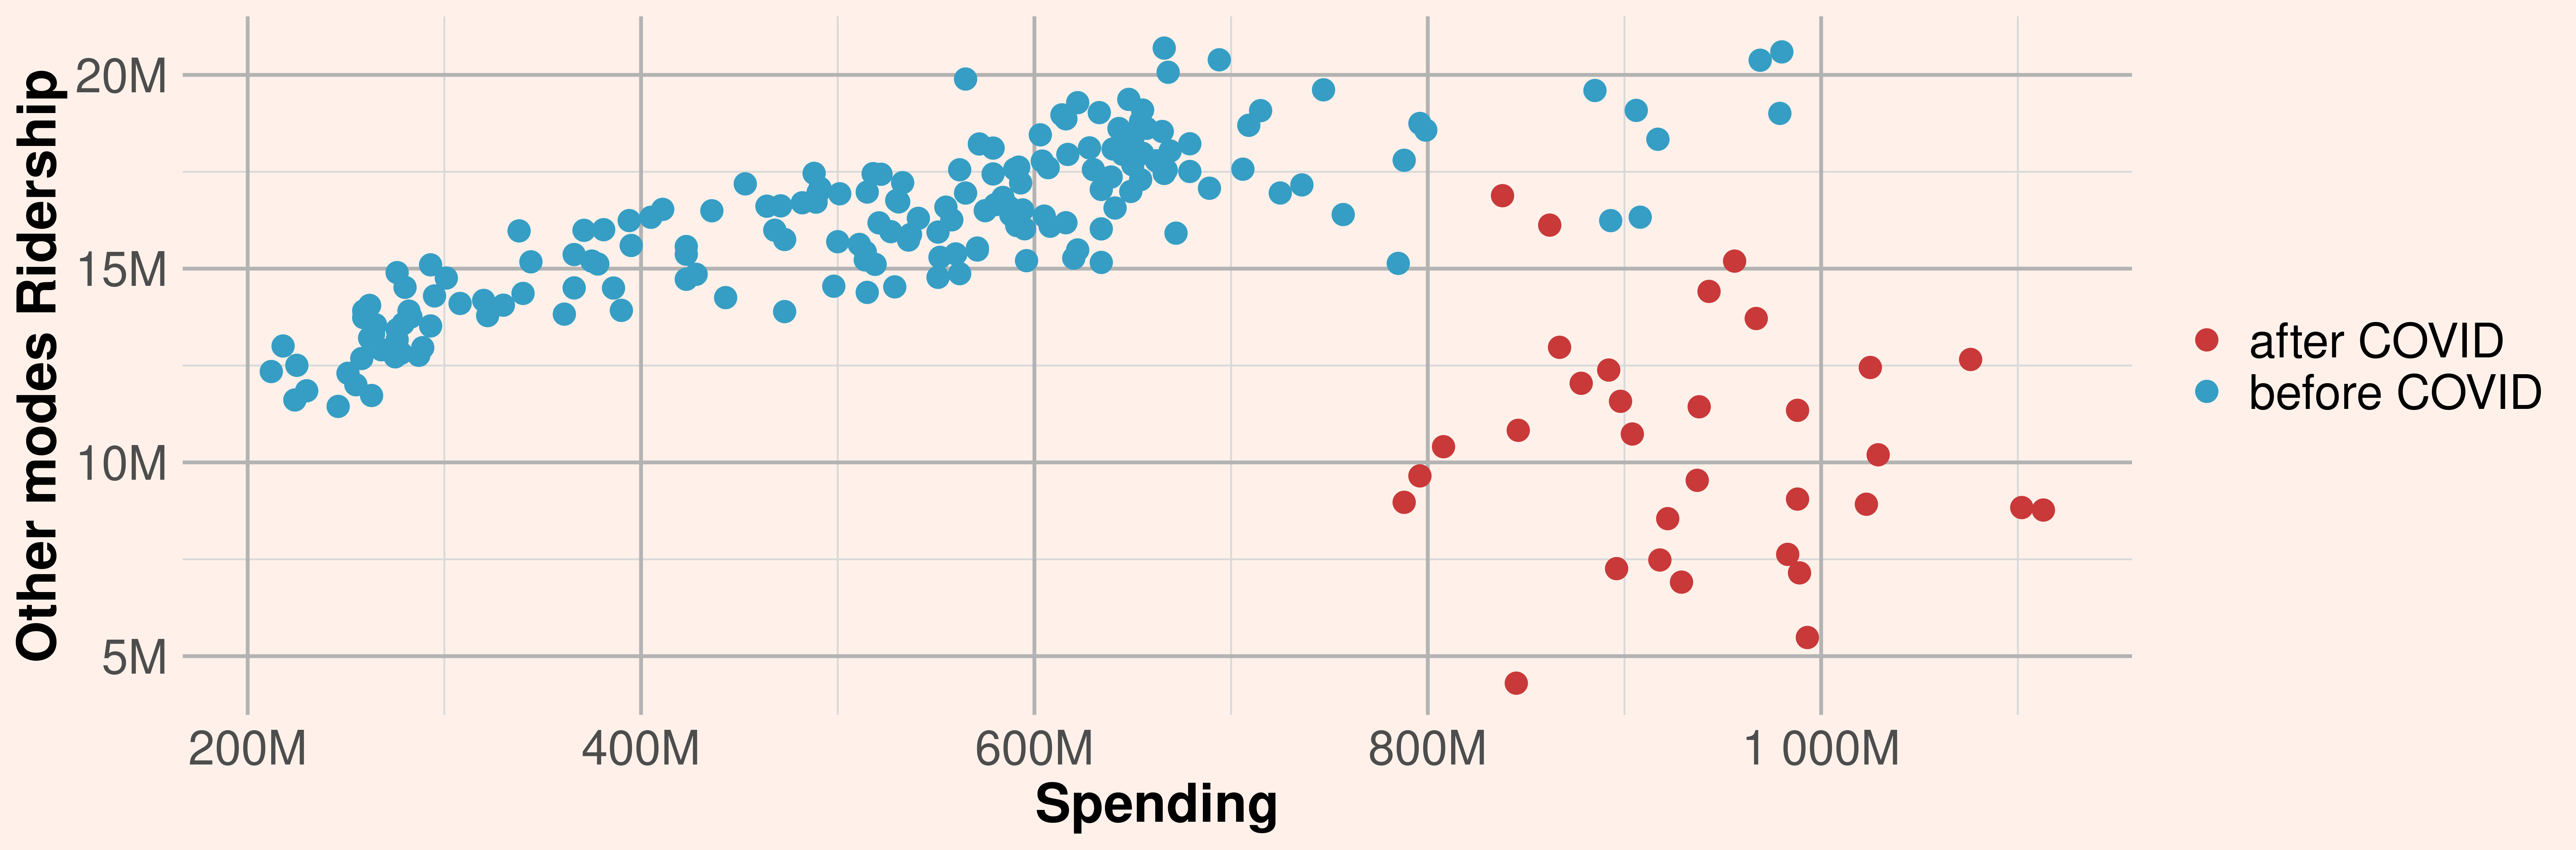
Other modes Ridership & Infrastructure Investment correlation by Period
Correlation heatmap
“Other modes” ridership is strongly and positively correlated with infrastructure investment (spending_transit) and economic growth (real_gdp)
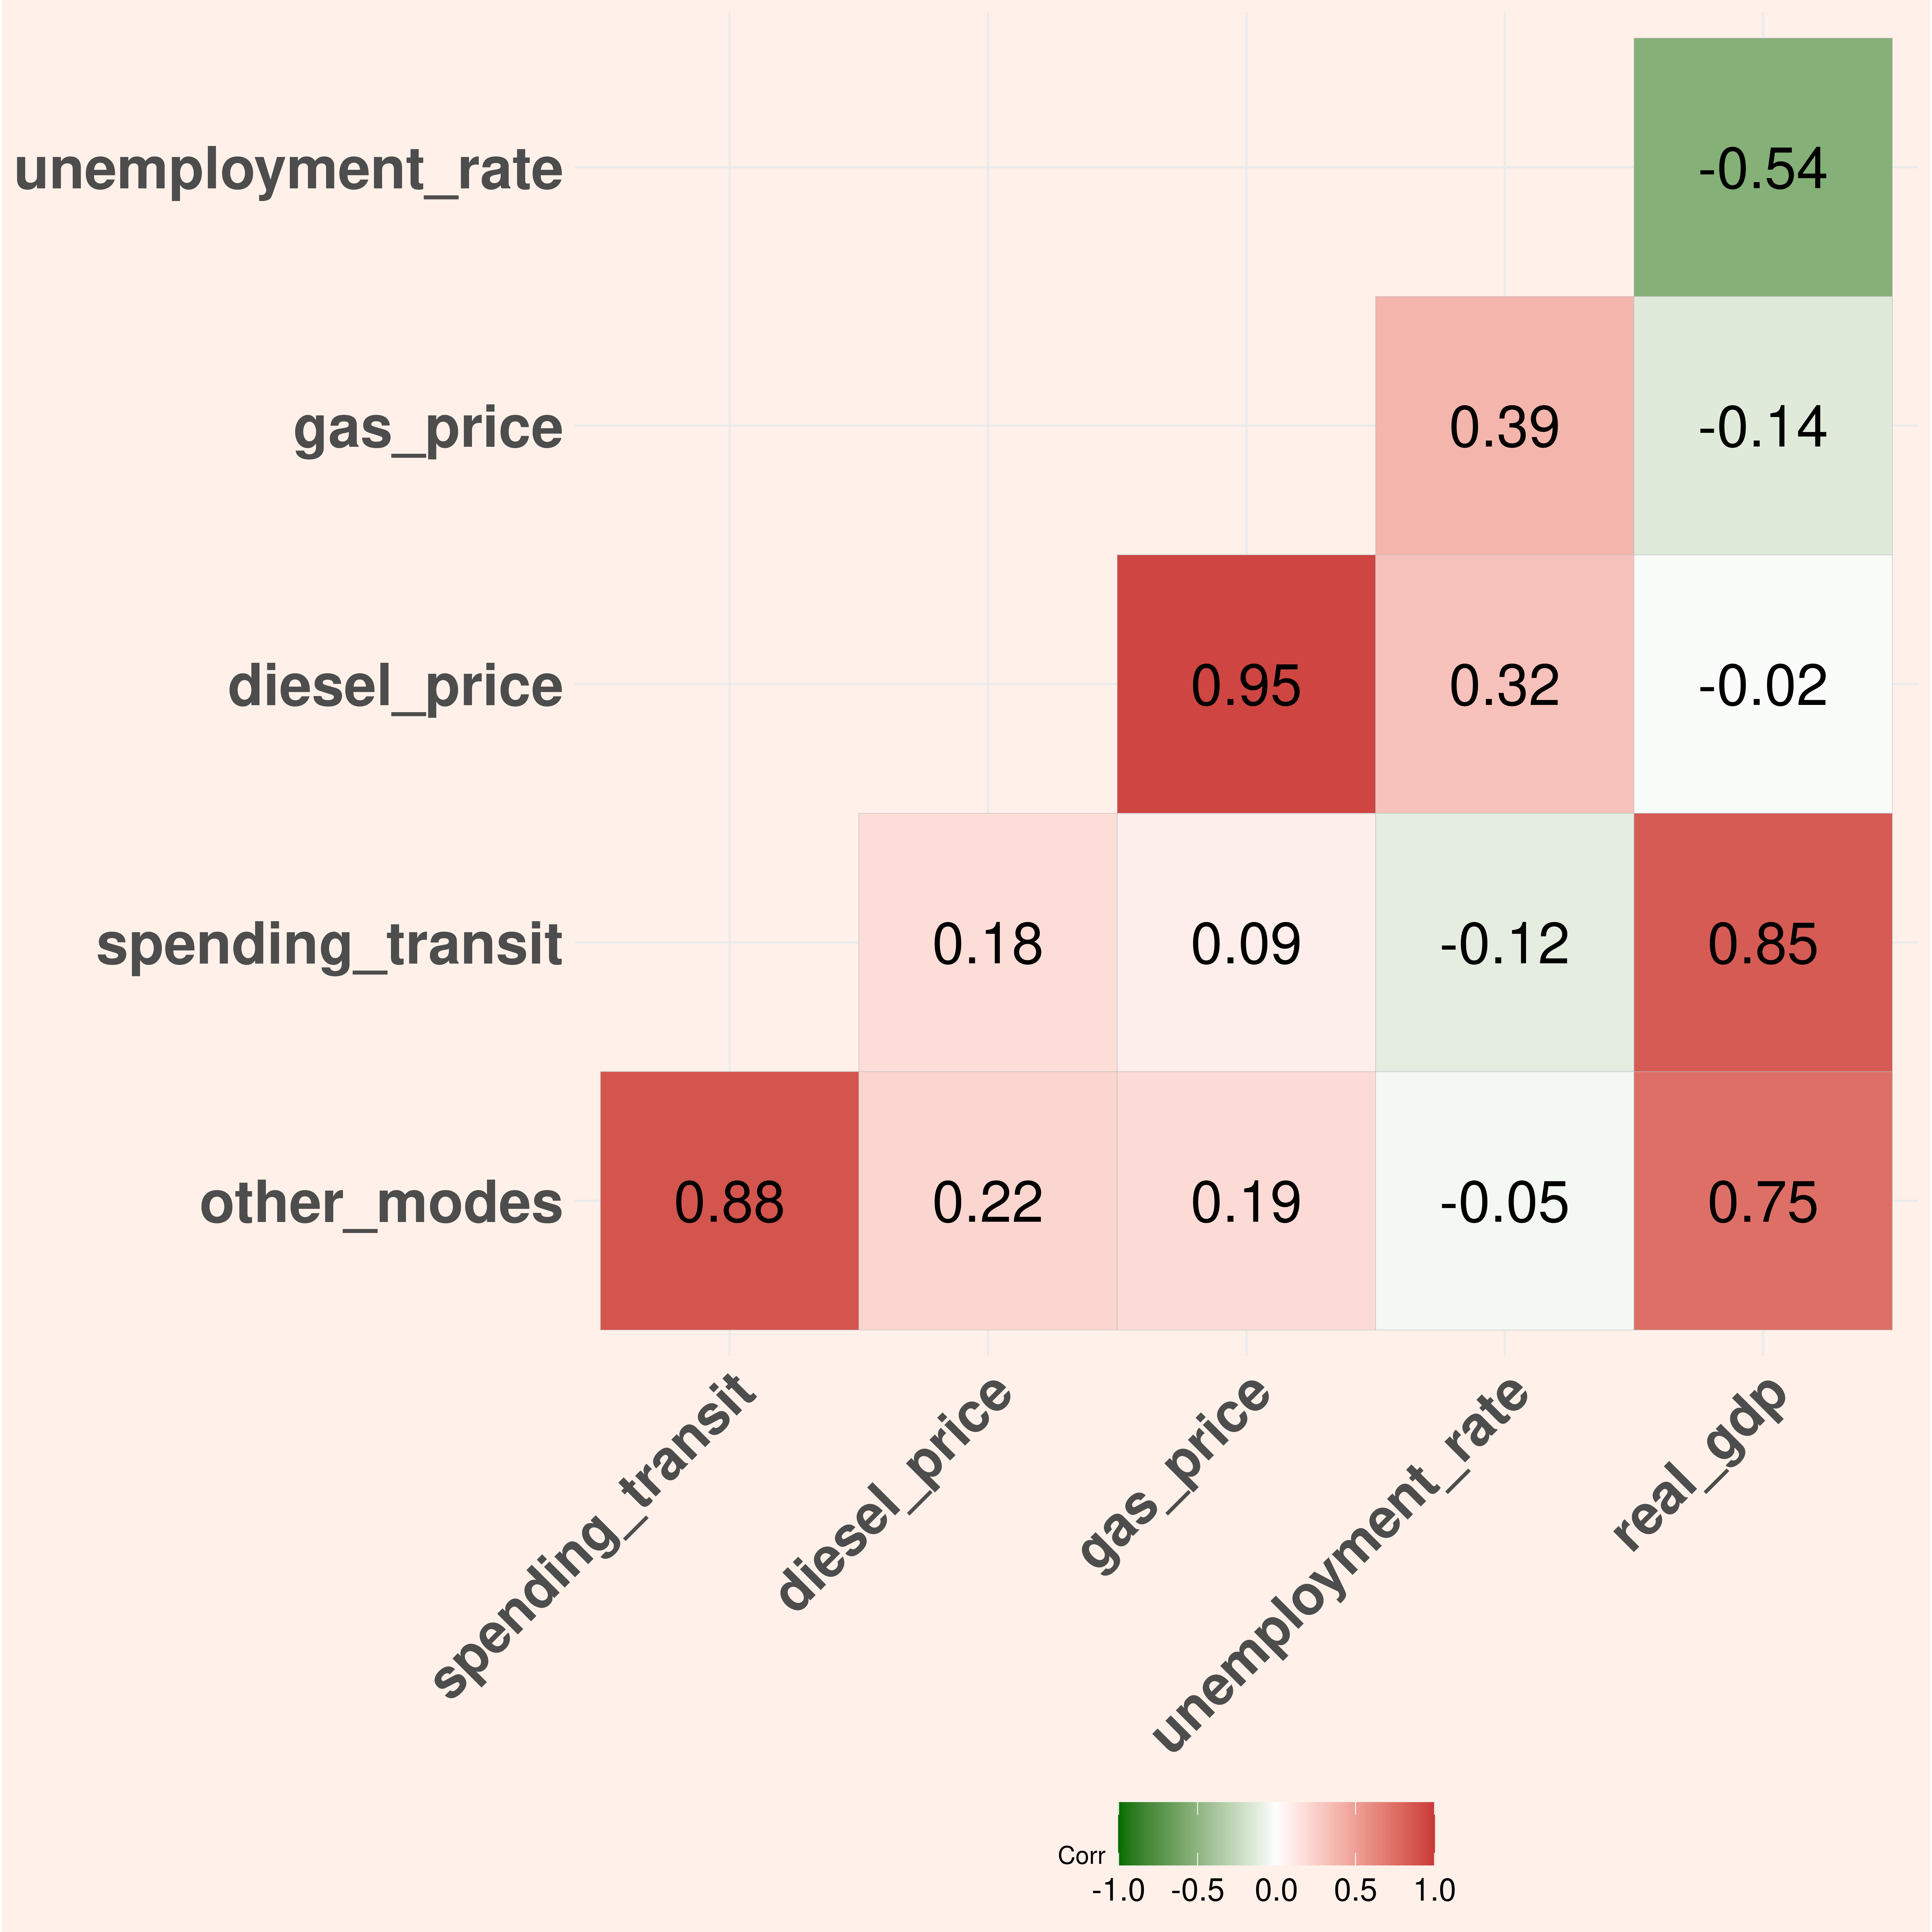
Influential Factors on Ridership (Pre-COVID)
“Other Modes” ridership is driven by a mix of factors. While economic growth and gas prices provide a strong positive push, rising diesel prices act as the most significant deterrent